
Monitor, Analyse, and Document Your Data
With MAPGRAPH Air Quality all air quality and emission data can be gathered into one application for ease of access and analysis. The solution automatically calculates air quality indexes and presents them in both custom dashboards and diagrams. Imported data can be verified with a 2-step partially automated validation procedure to verify each data source’s uptime and performance. Data can be imported from almost any source, including measurement stations, other databases, and SCADA-systems.

MAPGRAPH Air Quality Portal
Publish air quality, emission, and climate data to the public in an embedded, map-based portal. The portal incorporates local monitoring regulations and air quality indexes, providing citizens with an interactive and easily readable portal. The portal updates itself when new data are imported to MAPGRAPH.
- Data from air quality stations are continuously acquired.
- Location in maps provides context and overviews, of total air quality and for each parameter.
- A 2-step validation procedure allows the operator to evaluate and comment on invalid data published.
- Advanced graphics such as the air index IQAr in accordance with National Standards.
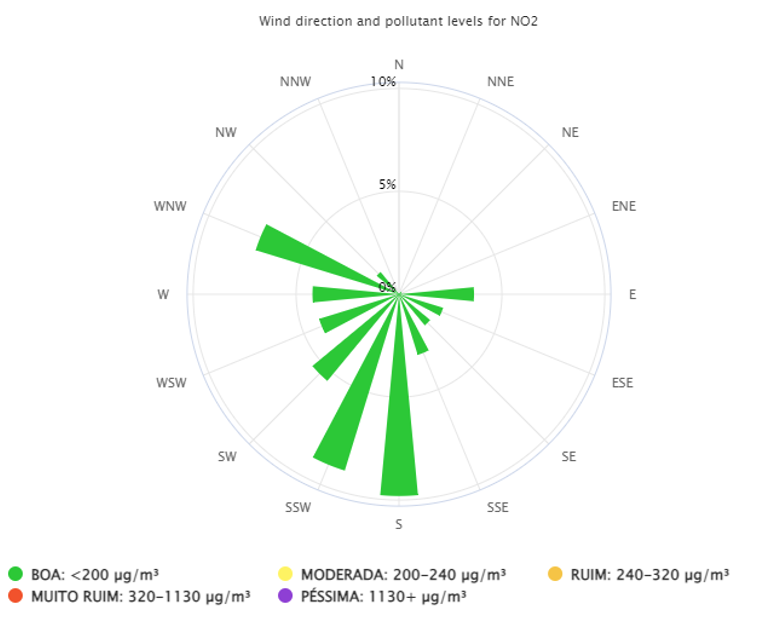
- Air quality together with wind direction provides concise information on the location in question.
- MAPGRAPH Air Quality offers enhanced capabilities for presenting data to the public and for professional purposes
See pricing and order information at
Veracity by Det Norske Veritas